Data Source

The clinical data from all first time outpatient visits (n=5 447 202) over 4-year period (2013-2016) in the Children's Hospital Zhejiang University School of Medicine (ZUCH). The weather data for each day including temperature (℃)[average, high and low],dew point (℃)[average, high and low], humidity (%)[average, high, low],visibility (km)[average],wind (km/h)[average, high and gust wind] and rainfall (mm) during the study period of Hangzhou were collected from the weather underground website (www.wunderground.com).
Age Patterns
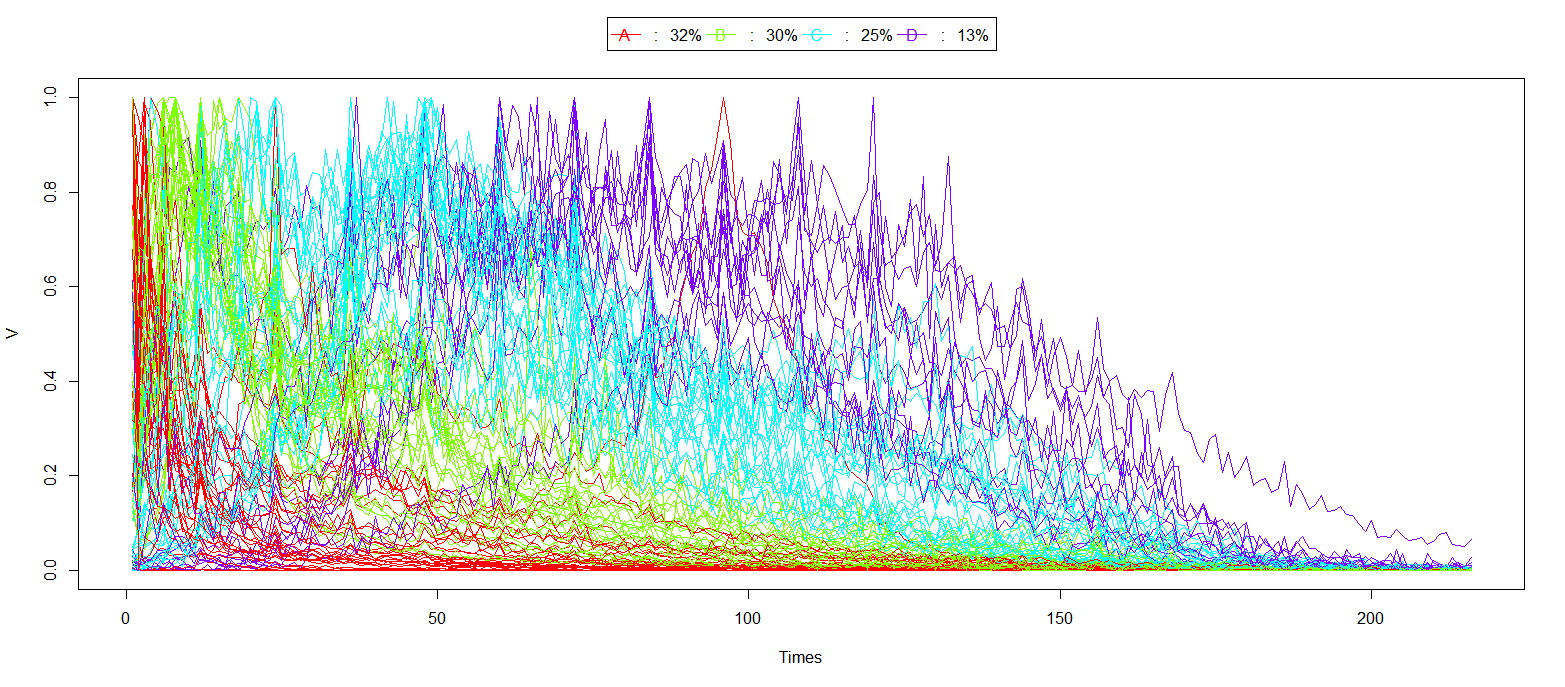
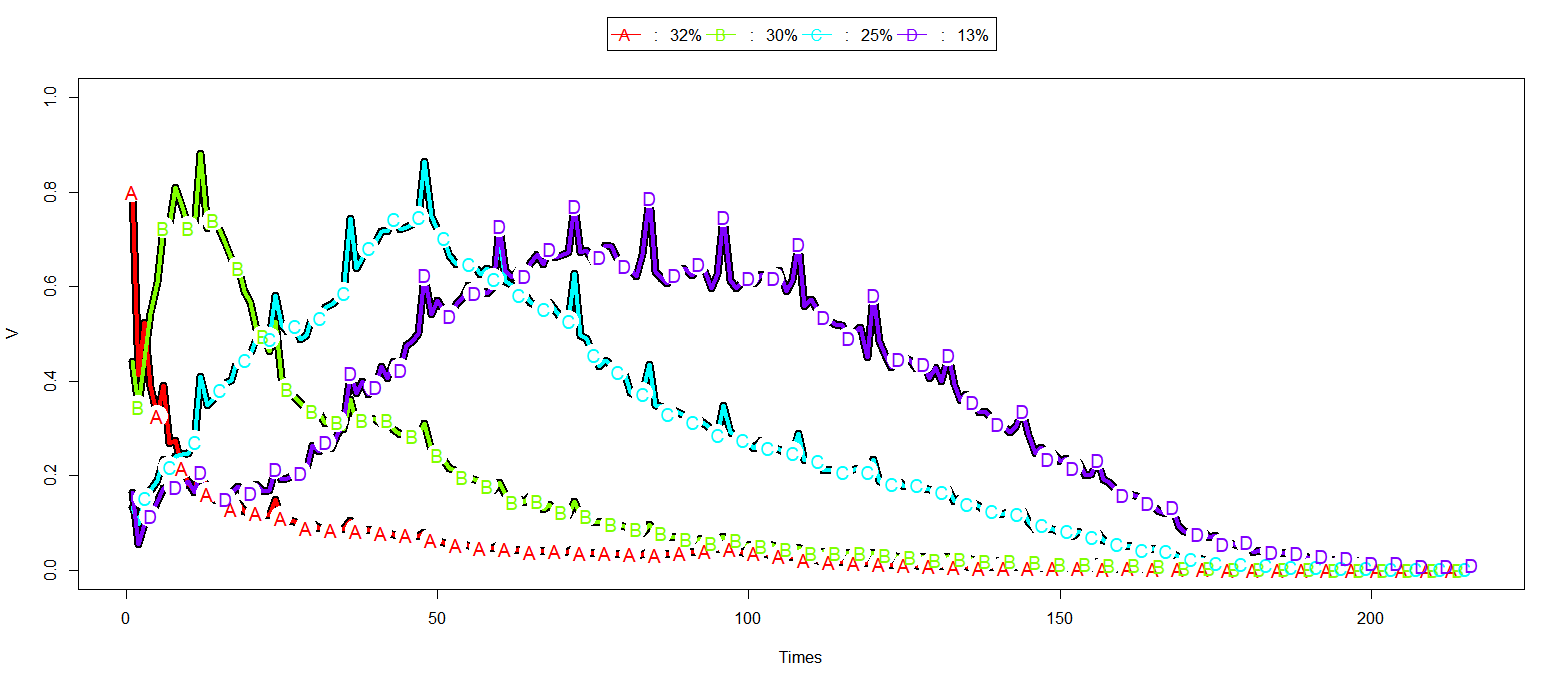
The age histogram of most common 100 pediatric diseases were normalized based on its maximum peak and then clustering them based on kml (a k-means for lonitudinal data)in R. We choice 4 clusters and observed the clustering and defined it as "A:little infant","B:infant","C:toddler","D:school-children".
Season Patterns
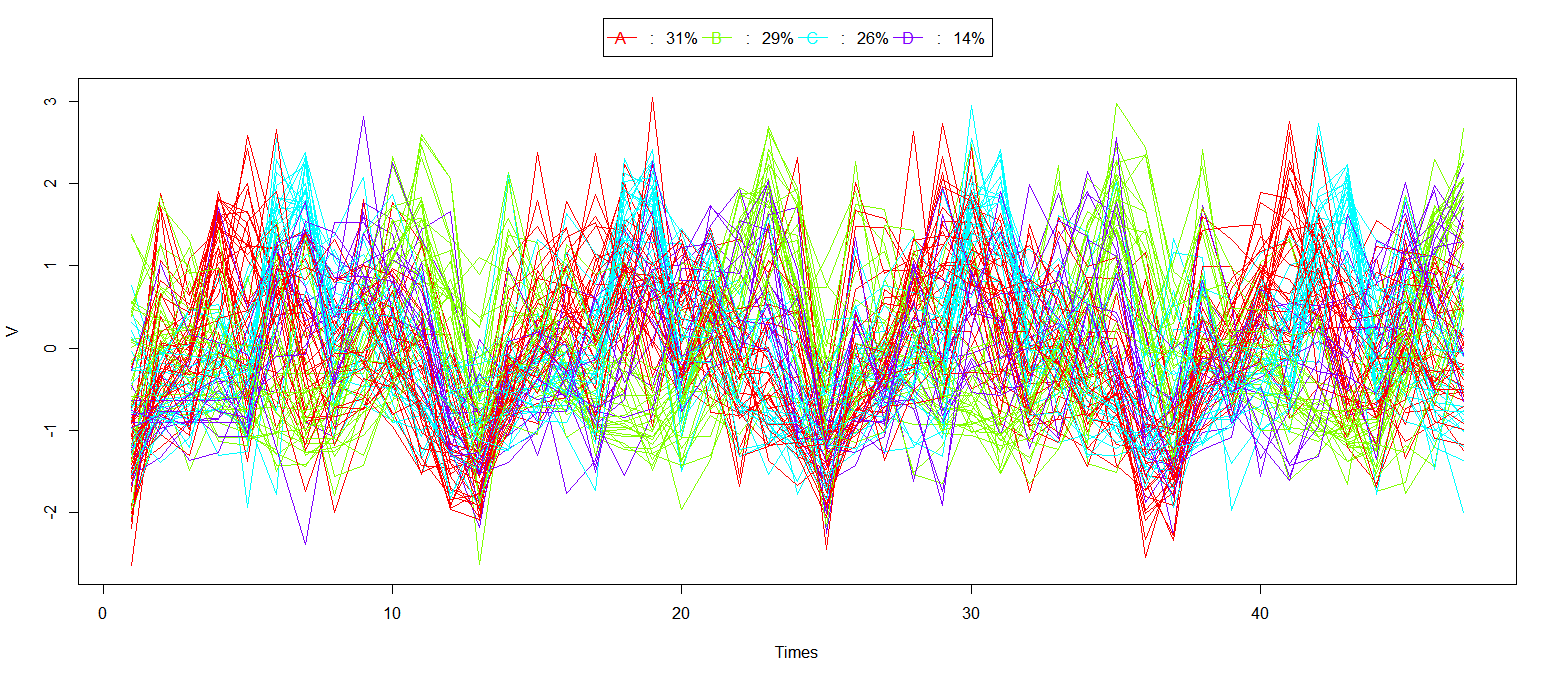
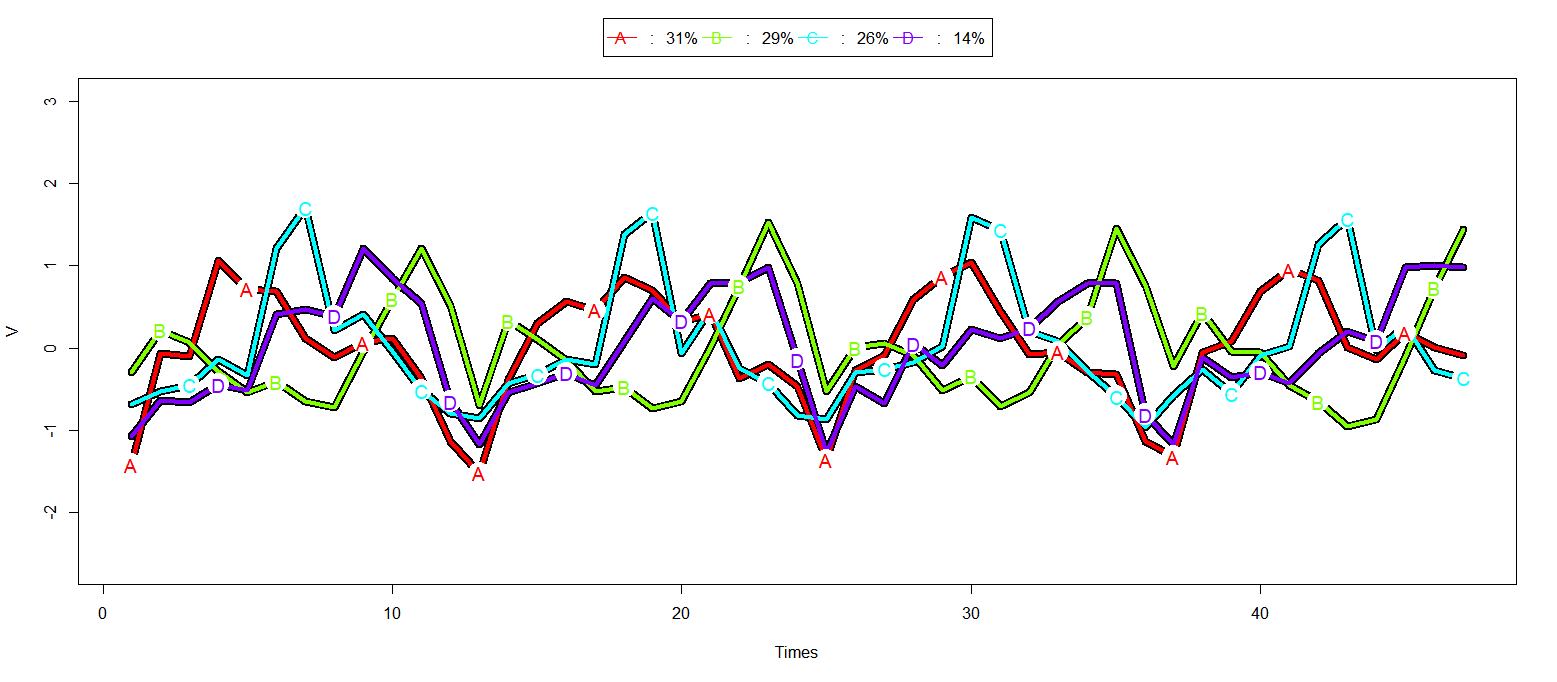
The incidence of most common 100 pediatric diseases each month were normalized to Z value and then clustering them based on kml (a k-means for lonitudinal data)in R. We choice 4 clusters and observed the clustering and defined it as "A:Spring","B:winter","C:summer","D:autumn".
Bird View of Pediatric Diseases
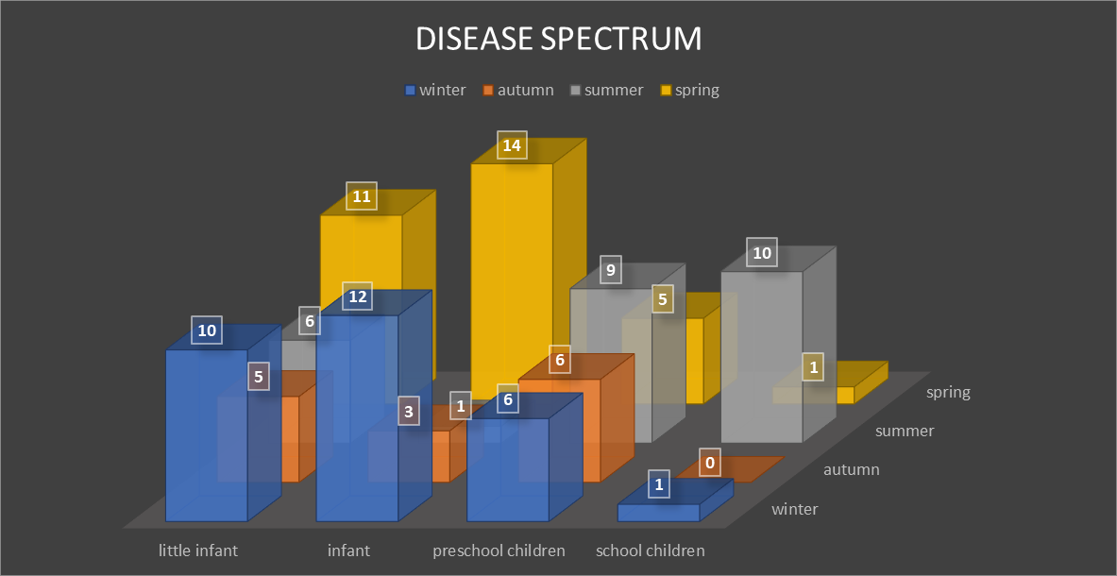
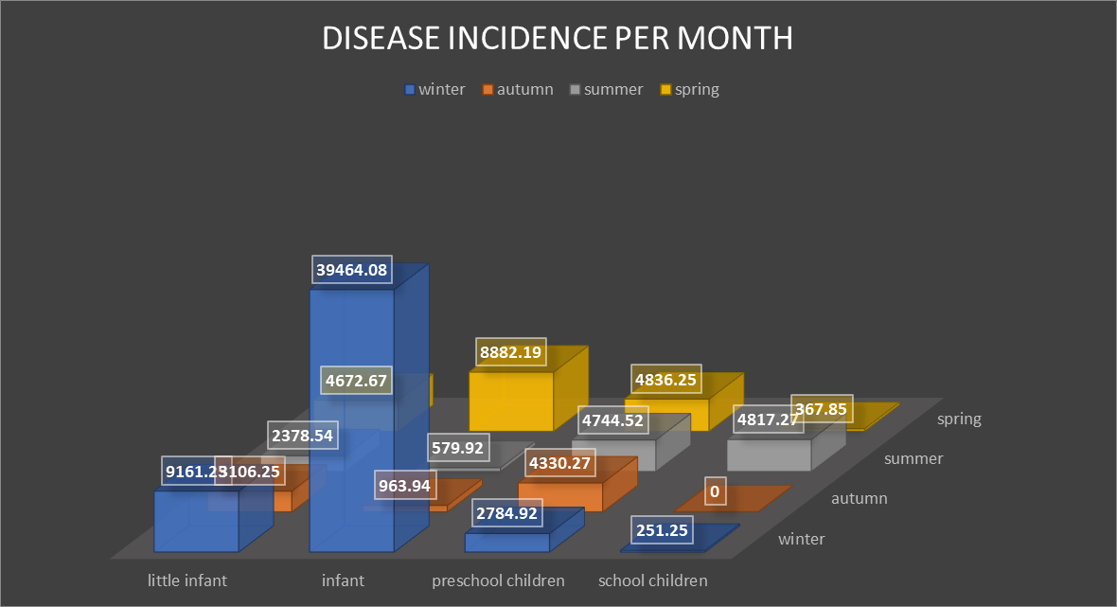
The top figure shows the top 100 pediatric diseases distribution in age and season patterns. The bottom figure shows the incidences distribution in age and season patterns.
Cooccurence Pattern
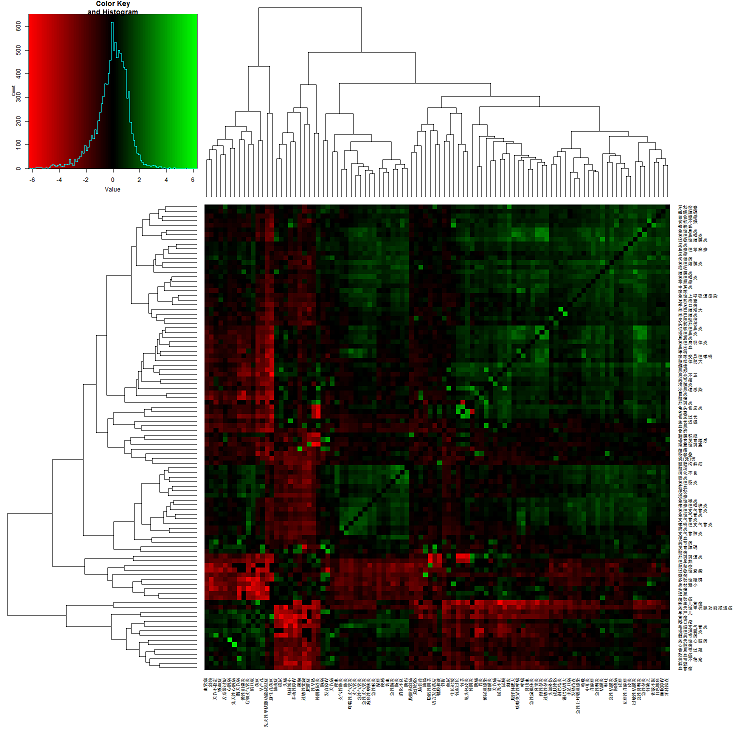
The odds ratio of coocurrence among top 100 pediatric diseases were calculated. The detials can be accessed on each disease page. It will help to identify the relationship among different pediatric diseases.
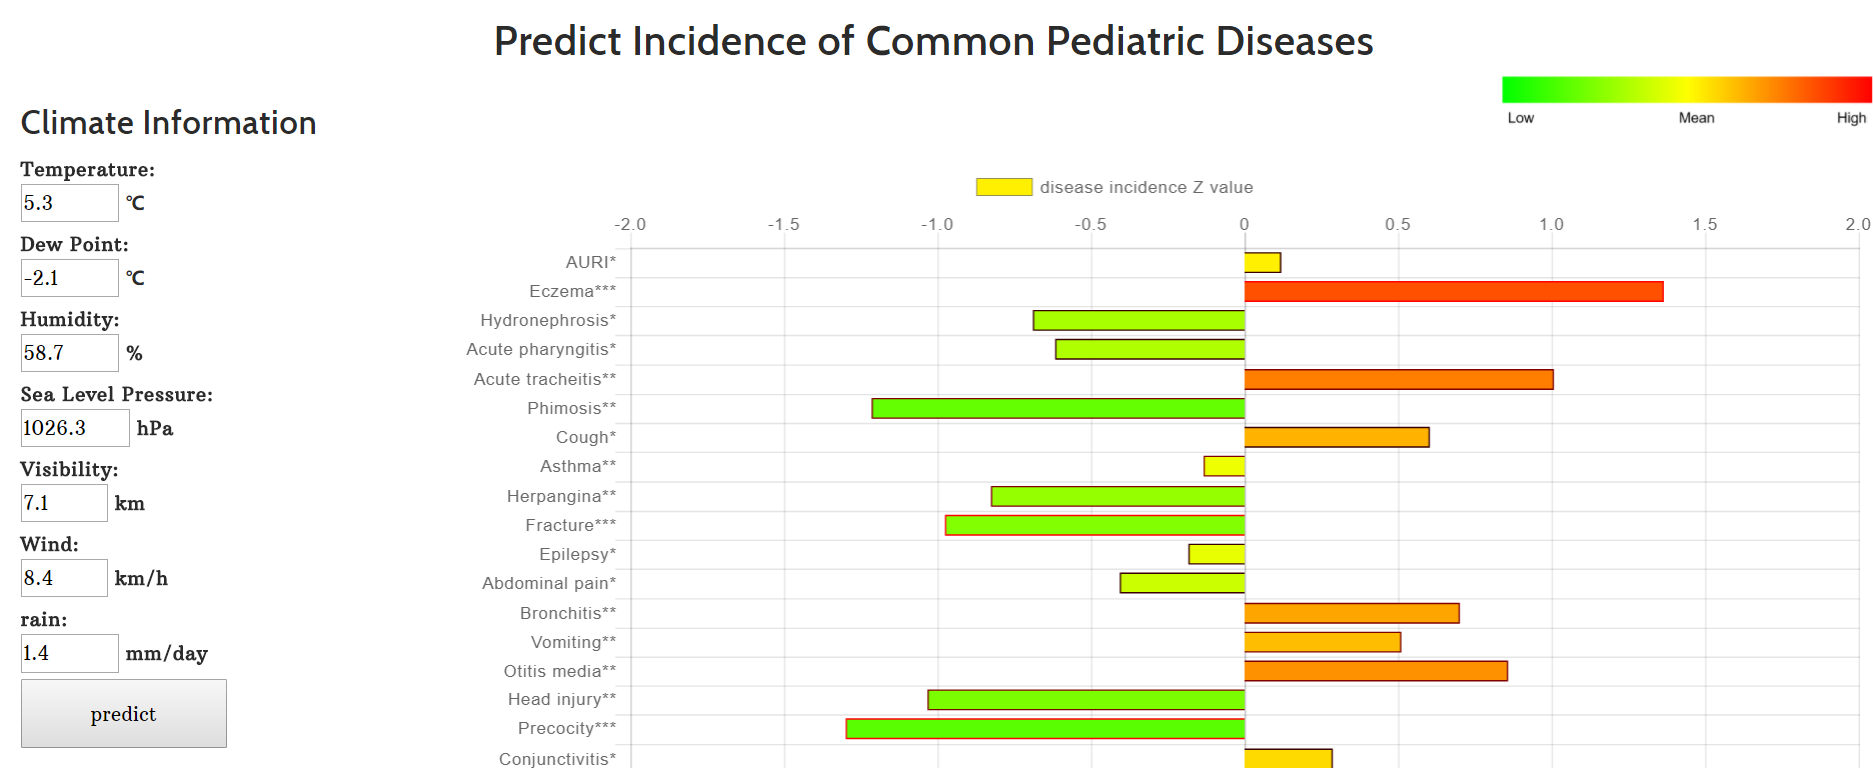
Prediction model
The meteorological factors including temperature (avg), humidity (avg), dew point (avg), sea level pressure (avg), visibility (avg), wind (avg), precipitation (avg) were used to build a Poisson regression model for each diseases. User can cusomize the climate information and predict the incidence z value of each diseases.